Guide: Dashboard Overview
Welcome to the exciting new features of our Dashboard! We are thrilled to introduce the Dashboard Overview, designed to provide you with the most important and relevant metrics, along with actionable resources. If you have any questions, feel free to reach out to us at support@gigs.com.
What is the Overview Page?
The Overview page is designed to provide a comprehensive view of your data, accessible to all user types, roles, and permissions. The tables are filtered by default to display data within a timeframe that is most relevant, making it easier for you to take actionable steps.
All Time Reports
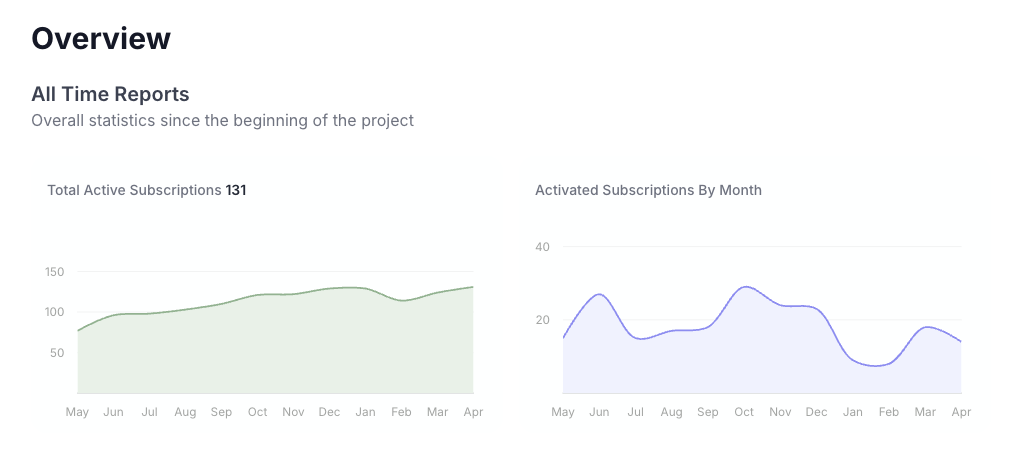
Total Active Subscriptions Chart
This chart displays the count of total active subscriptions for each month over the past 12 months, including the current month. The number next to the chart title indicates the value for the current month (for example, "38,803").
Note: If a subscription ends in the middle of the month, it will still be counted as an active subscription for that month.
Activated Subscriptions Chart
This chart shows the count of total activated subscriptions for each month over the past 12 months, including the current month. An activation refers to the first month in which the subscription became active, but does not include any subsequent months.
30 Day Reports
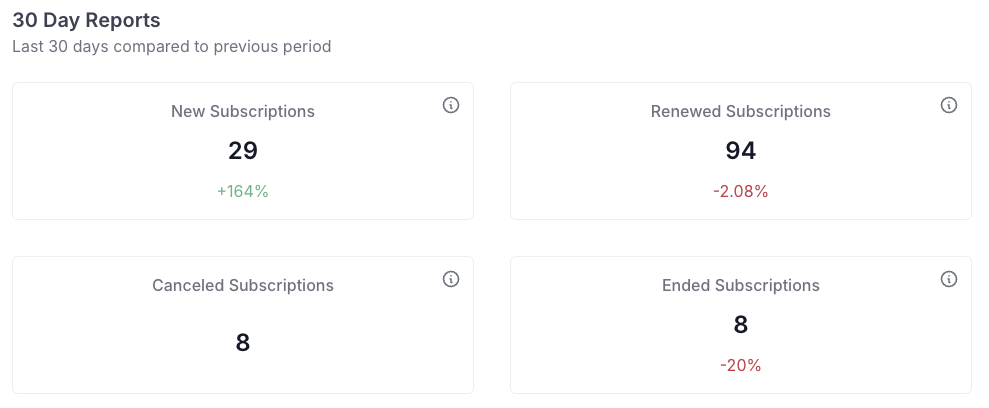
This section provides several key metrics, including:
New Subscriptions
Renewed Subscriptions
Canceled Subscriptions
Ended Subscriptions
Each metric displays:
A main value calculated based on the last 30 days.
A secondary value shown as a percentage, representing the trend over the last 30 days compared to the previous 30 days.
Hovering over the icon in the upper right corner reveals more information about how each metric is counted.
Resource Tables
This section features several tables that are pre-filtered by status and date to highlight the most actionable data. Each table displays a maximum of 5 items. If the number of matching items exceeds 5, a ‘View All’ link will appear at the bottom of the table, allowing you to navigate to the main resource table view with a similar status filter applied. If there are fewer than 5 items, this link will not be shown. If there are no matching items, the entire table will not be displayed.
Data in every table is sorted from newest to oldest.
Portings with Action Required
This table shows portings with the following filters applied:
Status: declined or information required
Updated at least 24 hours ago, but no more than 30 days ago
Failed Payments for Renewals
This table displays payments with the following filters applied:
Status: failed
Attempted: 3 times
Created at least 5 days ago, but no more than 30 days ago
Note: A failed payment could have been created more than 5 days ago but last attempted less than 5 days ago. We only consider the former date regarding failed payments.
Approved Consent Requests
This table shows consent requests with the following filters applied:
Status: approved
Currently, the only requests shown here will be for issuing port-out credentials, as this is the only consent operation requiring manual fulfillment.
We hope you enjoy exploring the new Dashboard Overview and find it helpful in managing your subscriptions and resources effectively!


